Moshe Nadler
One of the things I love the most with AWS is auto-scaling. You choose an AMI, set some parameters and AWS will spin instances up and down whenever a threshold is breached.
But with all these instances spinning up and down there are some unknowns. For example, what is the IP address of the new instance? Its host name? This can be critical when other components of your infrastructure are dependent on knowing these parameters. I had this problem when I started to use Zabbix as the monitoring system. At first it seemed like a complicated one, but Zabbix has a wonderful feature called Auto Registration which can be used exactly for this situation.
I will try to show how to configure auto registration both on the client (EC2 instance running Ubuntu 14.04) and on the Zabbix server (Zabbix Server 2.4.2).
Zabbix-agent Installation and Configuration
Let’s start with installing zabbix-agent on the Ubuntu client:
$ sudo apt-get update
$ sudo apt-get install -y zabbix-agent
The zabbix-agent will install its configuration file to /etc/zabbix/zabbix_agentd.conf. Edit the file with your favorite text editor and make the following changes to the file:
Server=host name or IP address of the Zabbix server
ServerActive=host name or IP address of the Zabbix server
#Hostname=Zabbix server (Make sure it is commented out so you get the actual host name)
HostMetadata=Test
Take a good look at the last option (HostMetadata). I have set it to “Test” but you can set it to any string you like. This is the information that the new instance will send to the Zabbix server when it starts, and as we shell see, it will be used to auto register the host.
Last, lets restart the zabbix-agent service:
$ sudo service zabbix-agent restart
By default, the zabbix-agent will listen on port 10050/TCP for connections from the Zabbix server. Make sure that the Zabbix server can access the client on this port.
Auto Registration Configuration
Login to your Zabbix server dashboard and navigate to Configuration | Action. In the Event source (1) select Auto registration and then press on Create action (2):
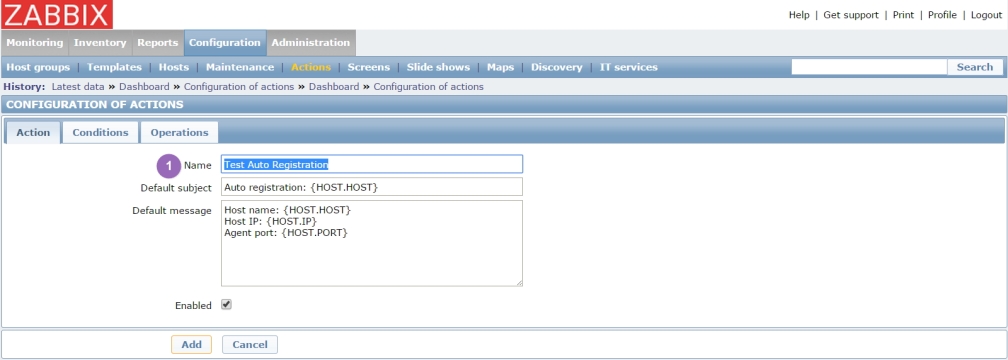
In the Action tab give a name for the action (1):
In the Conditions tab create a new condition where Host metadata is equal to the Hostmetadata that was configured in the agent configuration file (1) and add it to the conditions (2):
In the Operations tab you can set actions to be taken when the host auto register itself. In the following example the host with the “Test” metadata will be automatically added and also linked to the OS Linux template (1). To finish and add the action press on Add(2):
By default, the Zabbix server will listen on port 10051/TCP for incoming connection from its clients. Make sure that the client can access the Zabbix server on this port.
With the Zabbix client and server configured we can either wait for the zabbix-agent to register itself, or restart the zabbix-agent if we are impatient. In the end, you will see that the new host had registered itself in the server.
The host metadata is a very powerful feature. In my case, I have a number of different auto-scaling groups. For each group I use a different value for the host metadata. So, when the instances register themselves on to the Zabbix server each of them will be linked to the relevant templates based only on the value of the metadata.
One more thing, you will need to take care of the removal of the host from the Zabbix server when the auto-scaling group terminate the instance. I use a Python script, which utilize the Zabbix server APIs, to remove the instance from the Zabbix server when it is terminated by the auto-scaling group . The script is triggered when the OS is shutting down by using a shutdown script located under the /etc/rc0.d directory.


Just wondering… why Zabbix? Zabbix, like Nagios, requires server-side configuration of instances. Very generally speaking, for large scale systems, it might be wiser to use Graphite, InfluxDB or Prometheus as time-series databases and have your instances push metrics so that you don’t have to configure them server-side everytime. The instances can provide the hostname within the metric structure (and even better, if you’re going Metrics2.0, send as much metadata as possible).
LikeLiked by 1 person
Good information about Auto Registration Configuration. Must read this post !
LikeLiked by 1 person
@Niro: Prometheus require agent (extenders) as well so you have place to scrub data from or use other tool which provide metrics. For normal system monitoring old good tools like Zabbix and Nagios are perfect. Easy to write plugins, create graphs (which you really need) and generate less traffic. You always need server-side configuration.
“and even better, if you’re going Metrics2.0, send as much metadata as possible”
And what you will do with this GB of useless data ? Generate more graphs ? What for ? Just because it is fancy ?
With auto registration/auto discovery and templating in Zabbix only what you will need is 3 line setup in zabbix_agent config. Rest will be done automatically.
You can use Graphite with Zabbix as well.
” it might be wiser to use Graphite, InfluxDB or Prometheus as time-series databases”
Nop it not wiser, is more trendy now.
Admins are not data analytic. They don’t have a time to look graphs which are not provide what they want. In most cases you even not login to GUI for months and relay on triggers and tickets rises by them.
LikeLiked by 1 person